Eleven years is nearly an eternity for computing hardware. In my IT glory days, we said that a 3 year old PC was effectively at its end of life. We tried to budget for a 3-year replacement cycle, but it often stretched to 4 years. The technology zoomed ahead so fast that an older computer would barely run the latest operating system and fancier software applications.
That's easy to say when we're talking about other people's money, but for myself, I try to stretch my investments when I can.
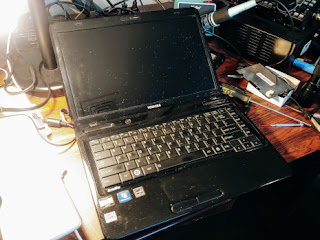 |
Toshiba L645D
|
The last laptop computer I acquired was this
Toshiba L645D. In 2010, it was already an economy model selling at a hair under $500. With its "triple core" AMD processor, you got Windows 7. Upgraded to dual boot Ubuntu Linux, it served for presentations and other uses for a good 10 years.
Not forever, though. Recently I brought it out for some reason and found that its battery would not take a charge. (I was on my second battery.) OK, new batteries are available for about $25. I got one, and verified that it would charge up normally, according to the LED indicators. So I pushed the power button, but apart from a few LED flashes nothing more happened. No display, no boot.
OK, there's another battery to check. The "CMOS" battery is a 3-volt lithium cell, like the one that probably lives in your PC. You have to unbutton your machine and dig for it. I dug for mine, but it popped up and out and into the internals of the laptop. Oops. That means I have to disassemble the machine -- not a simple task. Fortunately, there are good instructions at ifixit.com for just this system.
I got it apart and found the battery OK, and I was set to put in a new one. But the battery holder was a flimsy plastic item that I had broken when I removed the old battery. Yikes! Amazon had a replacement that seemed compatible, so I ordered it and waited a couple of days. (10 of them for ~$7.) Removing the old holder and putting in the new one required some semi-precision soldering, but it seemed to go alright.
Reintegrating the laptop parts (a 20+ step process) went not quite as smoothly as the disassembly, but well enough. I only had one small screw left over.
Alas, the Toshiba did not come to life! I am now reflecting on why I would put so much time into a system that at best would still be obsolete.
At least I do have a new battery pack and an 11 year old 320 GB SATA hard drive for the junk box.